


Is Our Transition to Renewable Energy Costing Us More Than We Thought?
The U.S. is in the midst of a major energy transition, moving away from fossil fuels, scaling renewables (such as


The U.S. is in the midst of a major energy transition, moving away from fossil fuels, scaling renewables (such as
The U.S. is in the midst of a major energy transition, moving away from fossil fuels, scaling renewables (such as solar, wind, and storage), and modernizing transmission and grid infrastructure; however, what is it costing us?
More importantly, is the transition to renewables costing us more than we initially thought?
That is the question I’ll be discussing in today’s article.
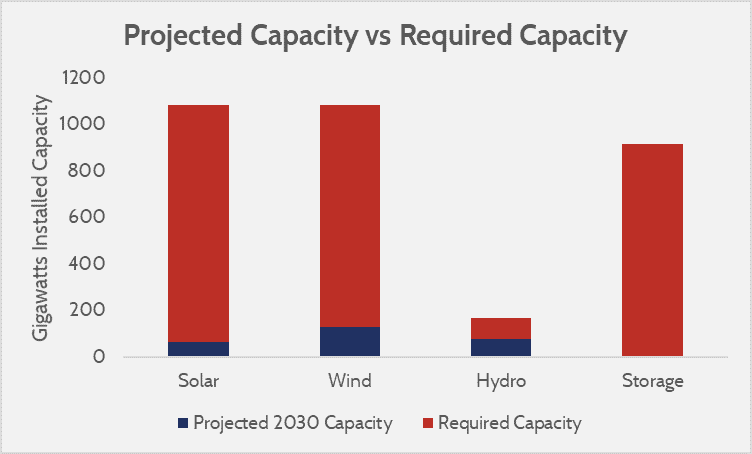
“To move 100 percent of U.S. electricity production to renewable sources would require at least $5.7 trillion of investment in renewable energy and storage.” – AAF
“The year 2025 will be defined by a race to overcome constraints and fill a growing gap between supply and demand for clean energy.” – 2025 Renewable Energy Industry Outlook
This chart, provided by the American Action Forum, shows the projected renewable capacity by 2030, compared to how much renewable energy woul;d be required from each source, to meet 100% renewable energy:
The goal of running primarily on renewable energy is a very positive one, both environmentally and ethically.
A cleaner planet, less pollution, and sustainable progress are critically important goals.
However, when discussing the transition and its costs, it’s also essential to acknowledge that the shift to renewables entails a massive expense, poses concerns about energy reliability, and presents significant infrastructure challenges.
And those costs don’t just sit on government balance sheets; they’re passed on to utilities and ultimately to you, the energy customer. And it’s already happening, as many electric utility customers will see renewable energy charges on their bills.
Another factor to consider, when discussing the subject, is that while renewable energy itself is clean, the process of building the generation means and infrastructure to support it isn’t always so.
For example, solar panels require silicon, aluminum, and rare earth materials, many of which are mined from the Earth through energy-intensive and environmentally invasive processes.
Large-scale solar and wind farms often require thousands of acres of land, which in some cases displaces farmland or natural habitats.
There have long been ongoing discussions about the environmental impact of hydropower, particularly its effects on aquatic plant life and fish populations in the rivers and ecosystems where it operates.
And, even battery storage, which is critical to making renewables reliable, relies heavily on lithium, cobalt, and nickel, often sourced from geopolitically sensitive regions.
I’m not here to “pick a side;” my goal is simple:
I want to examine whether the transition to primarily renewable energy is costing the U.S. more than we expected (and not just from a financial perspective).
In this article, I will present the facts, answer a very real question about cost, and help you understand how the transition to renewables is affecting the energy bills we all pay.
Now, many renewable energy advocates argue that the long-term benefits far outweigh the costs (cleaner air, climate resilience, lower operating costs), but in practice, there are growing pains, and some very real, measurable costs that are often underemphasized.
“In 2023, about 4,178 billion kilowatthours (kWh) (or about 4.18 trillion kWh) of electricity were generated at utility-scale electricity generation facilities in the United States. About 60% of this electricity generation was from fossil fuels—coal, natural gas, petroleum, and other gases. About 19% was from nuclear energy, and about 21% was from renewable energy sources.” – Energy Information Administration
According to the U.S. Energy Information Administration (EIA), in 2023, the breakdown of utility‑scale electricity generation was:
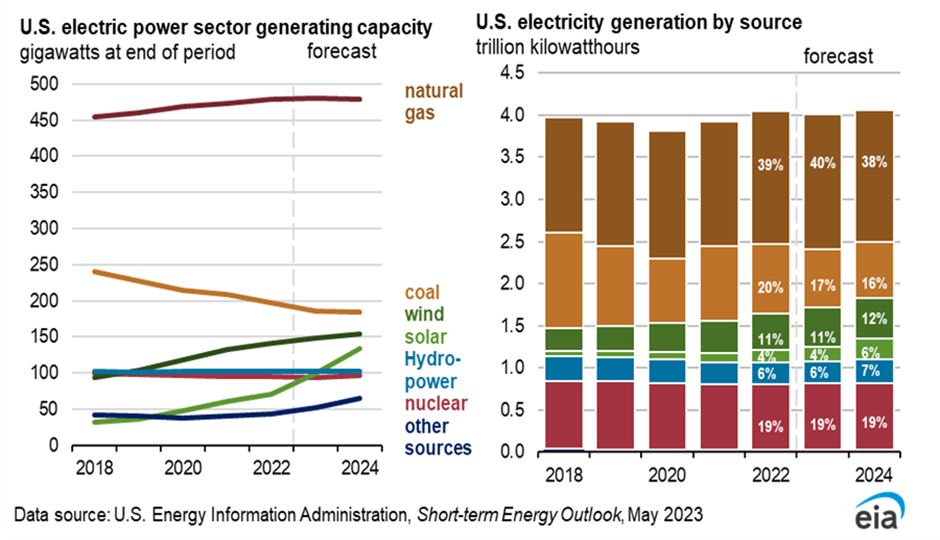
In short, even today, a little over one‑fifth of U.S. electric generation is from renewables, while the majority is still from fossil and nuclear sources.
Because the energy transition is dynamic, the share of renewables has been rising, and forecasts show continuing shifts:
The trend is upward for renewables, but the pace is gradual, and fossil fuels and nuclear power remain major players.
It also helps to see which kinds of renewables are contributing, and what “the rest” (non-renewables) look like:
Because of variability (solar during the day, wind depending on conditions), not all renewable capacity is “firm”—that is, able to reliably produce at peak demand. Hence, the “rest” has to carry the load.
So, in effect:
~21 % renewables + ~19 % nuclear + ~60 % fossil (especially gas & coal).
Because fossil fuels still supply ~60% of generation, any gap left by retiring fossil plants must be filled by renewables, storage, and new capacity, or by keeping fossil plants running longer (at some cost).
The rising share of renewables is encouraging, but not fast enough (in many cases) to maintain reliability, especially during peak periods, without backup or storage.
The mix change also forces changes in how fossil plants operate (ramping up/down, cycling), which can reduce their efficiency, raise maintenance costs, and increase emissions per unit. (Recent technical studies highlight this issue.)
Because renewable generation is intermittent, integration (storage, grid flexibility, transmission) becomes a core challenge. If infrastructure and storage don’t scale in tandem, the transition will strain costs, reliability, and system stability.
So now let’s take a look at the “transition” aspect
Here are the main levers through which costs (or unexpected burdens) are entering:
Below are some concrete facts and figures from recent reports and sources.
Utilities in the U.S. are planning to retire coal and gas capacity by 2025, with approximately 6.4 GW of coal-fired capacity and 4.1 GW of gas-fired capacity having been approved or announced for retirement.
But retirements are below the 10-year average. For example, coal retirements in 2024 were only ~4 GW, compared to a 10-year average of ~9.9 GW.
Also, there are DOE emergency orders/mandates forcing aging fossil fuel plants to stay online past their planned retirement dates. A recent Grid Strategies report estimated that keeping such plants operational (to avoid a supply shortfall) could cost ratepayers approximately $3.1 billion/year under a “low” estimate by the end of 2028. Under a more expansive scenario (where more plants are forced to stay), that cost could reach $5.9 billion/year.
One case: the J.H. Campbell coal station in Michigan was supposed to retire by May 2025, but the DOE ordered it to stay open until late August; that cost was $29 million for just 38 days.
U.S. data centers already consume more than 4% of the total U.S. electricity (as of 2023). Projections suggest that it could rise to 9% by 2030.
Demand from data centers is a key driver of projected load growth in certain regions. For example, in Virginia, Georgia, North Carolina, and South Carolina, utilities anticipate that data centers will be responsible for at least 65% of future load growth.
Rising demand coupled with extreme weather (heat waves) increases peak loads; these require peaker plants (often less efficient, more costly, and more polluting) or keeping older plants running more often.
Between May 2024 and May 2025, the average U.S. retail electricity price rose 6.5%, from about 16.41 cents/kWh to 17.5 cents/kWh. Some states saw significantly larger jumps: Maine (+36.3%), Connecticut (+18.4%), and Utah (+15.2%).
In the PJM region (Mid-Atlantic / Midwest), delays in building clean energy and interconnection queues, along with unreliable gas plants and rapid load growth (from data centers), have been found to push bills up by $20–30 per household per month in some cases.
There is a backlog of renewable and storage projects in grid connection queues. One report (Reuters) notes that there were over 2.5 terawatts (TW) of solar, wind, and battery storage projects in U.S. grid connection queues at the end of 2023.
Changes to tax law (e.g., phasing out key tax credits for solar, wind, and battery projects) may substantially slow down clean energy deployment. According to one analysis, such rollbacks could reduce clean energy additions by 53‑59% between 2025 and 2035. Then, because clean energy is among the cheapest sources, such a slowdown would raise electricity rates by as much as 49% in certain states, and ~18% nationally by 2035.
The new rules passed by the EPA in 2024 for emissions performance (which vary by technology) suggest that older, less efficient gas plants will incur higher operating costs under stricter emission standards; this raises mitigation costs and reduces operational flexibility.
“The law that President Trump signed on July 4 ending tax incentives for wind and solar projects is expected to drive up electricity bills across the U.S., with some of the sharpest increases in Republican-led states, according to Energy Innovation, a nonpartisan think tank.” – NPR
“These DOE orders, if they continue at the current pace, could impose an additional $3.1 billion to $5.9 billion annually on ratepayers by 2028.” – Power Engineering
Taking everything into account, the evidence suggests that the transition to renewable energy is indeed costing more than many initially forecasted. Some of these costs are unavoidable, as they are part of the structural investment required to shift away from fossil fuels.
But others are emergent: the result of delays, mismatched timelines, and policy or infrastructure bottlenecks that are now surfacing as higher costs passed directly to ratepayers.
For everyday consumers and businesses, these costs are already visible in electricity bills. Nationally, electricity prices rose by about 6.5% between May 2024 and May 2025, with some states, such as Maine and Connecticut, experiencing double-digit increases. And unless key issues are resolved, these increases could continue or even accelerate.
One of the most significant sources of these rising costs is delay. When renewable projects get stuck in permitting or interconnection queues, or when fossil fuel plants are retired without adequate replacement, utilities are often forced to keep older fossil plants online.
These plants are typically less efficient and more expensive to run. In some cases, the federal government has even issued emergency orders mandating that certain fossil fuel plants remain operational past their planned retirement dates—whether or not utilities wanted to keep them.
According to an analysis by Grid Strategies, the cost of these forced extensions alone could add anywhere from $3.1 billion to $5.9 billion per year to ratepayers’ bills by the end of 2028.
Another significant factor driving costs is the explosive growth in electricity demand, primarily driven by energy-intensive AI data centers and extreme weather events, such as prolonged summer heatwaves.
To keep up, utilities are investing in new fossil gas plants and ramping up transmission capacity—moves that require significant capital and drive up system-wide costs. Utility Dive and Reuters have both reported on how data center growth is pushing utilities to rethink their resource plans, often in ways that are more expensive in the short term.
Furthermore, if federal tax support for renewable energy were to be rolled back—such as the expiration of certain clean energy tax credits—the impacts could be even more dramatic.
One Financial Times analysis projected that such a rollback could increase electricity rates by 18% nationwide and up to 49% in some states by 2035, due to slower deployment of cheaper clean energy sources.
In summary, it appears that the transition to renewable energy is costing more than anticipated. And while some of these costs are investments in a more sustainable future, many are the result of policy friction, supply-demand mismatches, and infrastructural growing pains.
If not addressed, they risk undermining public support for what is ultimately a necessary and beneficial shift in how we power our lives.
To balance the picture, some cost metrics suggest the renewable transition also brings considerable savings or mitigations, which are often under‑emphasized.
The levelized cost of electricity (LCOE) from wind and solar has fallen dramatically over the past decade. Wind electricity (land-based) costs have decreased by ~70% from 1999 to 2022, while solar photovoltaics have decreased by ~83% since around 2010.
Renewable sources have very low operating & maintenance (O&M) costs and zero fuel costs (wind, solar). That means once built, they tend to provide cheaper electricity than most fossil sources (depending on capacity factor, transmission, storage).
Battery storage is scaling up: it helps with peak demand, smoothing out supply vs demand mismatch. Over 37 GW of battery storage was installed in 2023.
When all factors are considered, the answer appears to be yes; it seems that America’s transition to renewable energy is costing more than many early projections suggested, particularly in the short to medium term.
Many of those forecasts were built on optimistic assumptions: a smooth and steady ramp-up of renewable projects, cooperative regulatory environments, swift permitting, efficient interconnection processes, and a synchronized buildout of renewables and battery storage to seamlessly replace retiring fossil fuel capacity.
In practice, however, the picture has been more complicated. Delays in permitting, regulatory red tape, public opposition to large-scale renewable installations, and the lengthy process of siting new transmission infrastructure have all contributed to project slowdowns.
These setbacks have triggered a cascade of reactive measures, including emergency federal orders forcing aging fossil plants to remain online, which introduce unexpected costs and strain utility budgets.
At the same time, sudden spikes in demand, from the rapid expansion of AI data centers, increased electrification, and more frequent extreme heat events, have compressed deployment timelines. Infrastructure that might have been introduced gradually must now be fast-tracked, and that often comes at a premium.
While it’s nearly impossible to assign a precise dollar figure to the full cost of the transition, especially with so many variables still in motion, like grid storage scale-out, future demand growth, and permitting reform, this current information clearly shows that the transition is already generating significant, and often unanticipated, costs.
There are still many aspects of the energy transformation that haven’t been fully developed, tested, or priced.
That said, it’s important to keep perspective.
While today’s costs may feel higher than expected, many of them are transitional. Over the long term, a fully modernized grid powered by renewable energy and supported by robust storage and transmission systems promises significant economic advantages.
These include lower marginal operating costs, reduced exposure to fossil fuel price volatility, public health benefits, and long-term environmental savings. The challenge is that these future benefits are often underrepresented in today’s electricity prices, meaning ratepayers may feel the pain now, long before the gains are fully realized.
I’ve done my best to present a well-rounded view based on current data and credible sources; however, this is a complex and evolving topic, and I am aware that there’s more to explore. If you have additional statistics, personal insights, or perspectives that I may have overlooked, I’d truly appreciate hearing them.
Whether it’s a factor I didn’t mention, a trend you’re seeing in your own region, or a different interpretation of the numbers, your input is valuable. Send me an email; this conversation is far from over, and every perspective helps build a clearer picture of the real cost of the energy transition.

James Lightning
Senior Editor, Energy Professionals
(844) 674-5465
info@energyprofessionals.com
EIA – Electricity in the U.S. (Generation, Capacity & Sales)
https://www.eia.gov/energyexplained/electricity/electricity-in-the-us-generation-capacity-and-sales.php
EIA – What is U.S. electricity generation by energy source?
https://www.eia.gov/tools/faqs/faq.php?id=427&t=3
Power Engineering – DOE Orders to Delay Fossil Plant Retirements Could Cost Ratepayers $3 Billion+ Annually
https://www.power-eng.com/business/policy-and-regulation/doe-orders-to-delay-fossil-plant-retirements-could-cost-ratepayers-3-billion-annually-report-finds/
Utility Dive – DOE Mandates for Fossil Fuel Plants May Drive Up Rates
https://www.utilitydive.com/news/doe-mandate-fossil-fueled-power-plants-emergency/757653/
Renewables Now – Renewables End 2023 Providing 22.7% of U.S. Electricity
https://renewablesnow.com/news/renewables-end-2023-providing-22-7-percent-of-us-electrical-generation-849763/
Financial Times – Rollback of Renewable Tax Support May Raise Electricity Rates by 18–49%
https://www.ft.com/content/43174fe8-a875-4b19-bd78-77e4b6081fb0
Trellis – Data Center Demand Driving Electricity Price Increases
https://trellis.net/article/data-center-demand-electricity-prices-soaring/
NRDC – Real Reason Your Energy Bills Are Increasing (PJM Region)
https://www.nrdc.org/bio/claire-lang-ree/real-reason-your-energy-bills-are-increasing-pjm
Climate Central – Solar and Wind Record Generation in 2024
https://www.climatecentral.org/climate-matters/solar-and-wind-2025
Ember – U.S. Electricity 2025 Special Report
https://ember-energy.org/latest-insights/us-electricity-2025-special-report/2024-in-review/
Reuters – U.S. Power Use to Reach Record Highs in 2025 and 2026
https://www.reuters.com/business/energy/us-power-use-reach-record-highs-2025-2026-eia-says-2025-09-09/
MIT Energy Initiative – The Multi-Faceted Challenge of Powering AI
https://energy.mit.edu/news/the-multi-faceted-challenge-of-powering-ai/
EPA – Power Sector Evolution and Costs of Renewable Energy
https://www.epa.gov/power-sector/power-sector-evolution
America’s Power – The Cost of Retaining Fossil Plants to Ensure Reliability
https://americaspower.org/whats-the-cost-of-retaining-fossil-power-plants-to-ensure-reliability/
Canary Media – Forcing Dirty Power Plants to Stay Open Would Cost Americans Billions
https://www.canarymedia.com/articles/policy-regulation/forcing-dirty-power-plants-to-stay-open-would-cost-americans-billions
arXiv – Environmental Burden of U.S. Data Centers in the AI Era
https://arxiv.org/abs/2411.09786
arXiv – Ancillary Services in Power System Transition Toward a 100% Non-Fossil Future
https://arxiv.org/abs/2311.02090

Don't have one? You can get one by calling us at 855-4-PKIOSK.
Energy Professionals is committed to finding its customers the best possible rates on electricity and natural gas. Tell us your location and service type and our energy manager will connect you to the most competitive offers.
Switching to an alternate supplier is easy. There is no chance of service disruption, and you'll continue with your current utility for energy delivery and emergency service. Take a few minutes to discover your best offers, and enjoy the benefits of retail energy in your home or business.
1. Energy Type
2. Service Type
3. Zip Code
4.Local Company
5.Zone

We believe that knowledge is power. Here’s a free e-book that provides business solutions to reducing energy costs.
Download E-Book Free Energy Audit