


Energy Update | 15 Feb 2021
Polar Vortex Exacerbates Natural Gas Structural Supply Deficit https://youtu.be/2xGk9q5EICAIn my Jan 18th Energy Update, I said if the EIA’s 2021


Polar Vortex Exacerbates Natural Gas Structural Supply Deficit https://youtu.be/2xGk9q5EICAIn my Jan 18th Energy Update, I said if the EIA’s 2021
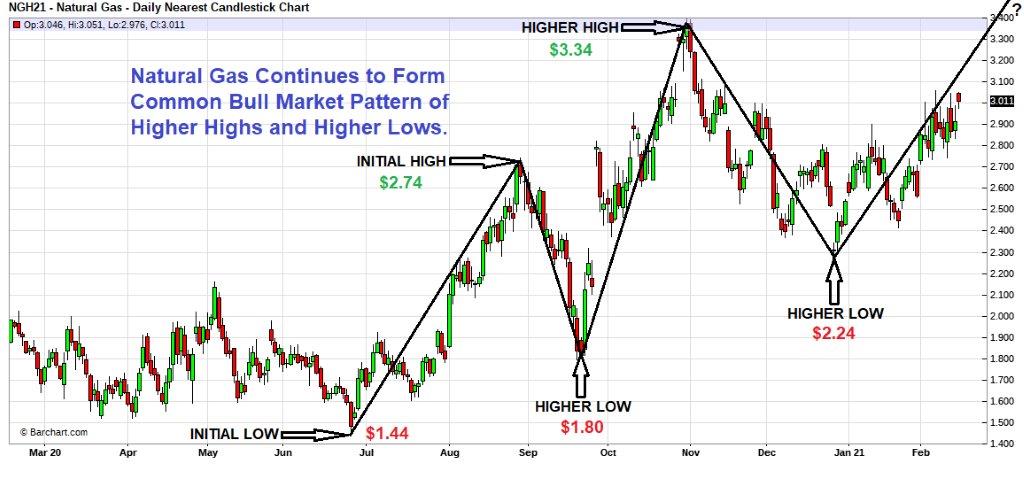
As you can see in the above chart, since my last report, Natural Gas has continued to form a common pattern of higher highs and lows early in bull markets, and the rally to a new high above $3.34 per MMBtu is becoming more and more likely.
In today’s report, I explain why the present polar vortex not only supports a Natural Gas rally above $3.34 per MMBtu but is exacerbating structural supply imbalances I discussed last month, which is increasing the risk of higher prices long-term.
In my Jan 18th Energy Update, I said based on structural imbalances forming in 2021, the EIA expected total inventories would be 1,620 Bcf by the end of March, which would be 12% below the five-year average for that time of year. But their estimate was based on average temperatures for this time of the year, and the polar vortex we are experiencing has increased demand for Natural Gas and supplies are falling quicker than the EIA expected.
Below is a summary of estimated supplies for the weeks ending Feb 5th thru Mar 5th compared to the 5-Yr. Avg. based on NOAA’s present weather forecasts:
Week Ending 2021 Net Change 5 Yr. Avg. 2021 vs. 5 Yr. Avg. % Change.
Feb 05 2,518 -171 2,366 +152 + 6.4%
Feb 12 2,256 -262 2,224 +32 + 1.4%
Feb 19 1,919 -337 2,104 -185 – 8.8%
Feb 26 1,762 -156 2,023 -261 – 12.9%
Mar 05 1,661 -101 1,934 -273 – 14.1%
Last month, the EIA expected Natural Gas’s total inventory would be 12% below the five-year average by the end of the winter heating season, but based on NOAA’s present weather forecasts, Natural Gas inventories, which started 2021 above the five-year average will soon fall below the five-year average and by March 5th, inventories will be 14% below the five-year average with nearly a month remaining in this year’s winter heating season.
In my Jan 18th Energy Update, I said If as expected structural imbalances continued in the second and third quarters of 2021 it would result in Natural Gas inventories being far below what would be needed for the winter heating season of 2021, and the risk of higher prices in 2021 and 2022 would increase. Clearly Natural Gas ending this winter’s withdrawal season with less supplies than the EIA expected last month increases the risk of higher Natural Gas prices both short and long term.
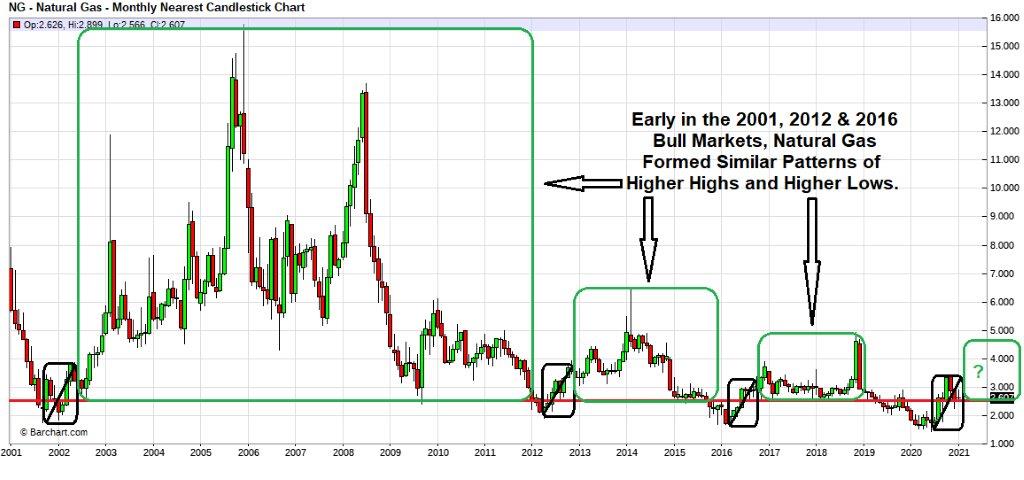
If you only looked at Natural Gas’s one-year chart in today’s report, you may feel you missed your opportunity to secure a low rate. But it is important to understand over the last twenty years the price of Natural Gas was only this low three times, 2001, 2012 and 2016, and each time it occurred early in bull markets that started with similar patterns of higher highs and lows, and the average price was always higher for at least three years:
Therefore, if you are not already protected, I trust today’s report will help you appreciate why it is in your best interest to secure fixed Natural Gas and Electricity rates at this time, the downside reward potential of lower prices short-term is minimal versus the upside risk of higher prices long-term.
Not every client’s risk tolerance and hedging strategy is the same, but the above report will help you put into perspective the risk/reward opportunities. I invite you to call one of our energy analysts to help you plan a hedging strategy appropriate for your situation.
Ray Franklin
Energy Professionals
Senior Commodity Analyst

Don't have one? You can get one by calling us at 855-4-PKIOSK.
Energy Professionals is committed to finding its customers the best possible rates on electricity and natural gas. Tell us your location and service type and our energy manager will connect you to the most competitive offers.
Switching to an alternate supplier is easy. There is no chance of service disruption, and you'll continue with your current utility for energy delivery and emergency service. Take a few minutes to discover your best offers, and enjoy the benefits of retail energy in your home or business.
1. Energy Type
2. Service Type
3. Zip Code
4.Local Company
5.Zone

We believe that knowledge is power. Here’s a free e-book that provides business solutions to reducing energy costs.
Download E-Book Free Energy Audit