


Energy Update | May 12th, 2020
Further Evidence Natural Gas is Near Completion of Seasonal Low. https://youtu.be/mU-3lAVjmeY In my May 5th Energy Update, I said it


Further Evidence Natural Gas is Near Completion of Seasonal Low. https://youtu.be/mU-3lAVjmeY In my May 5th Energy Update, I said it
In my May 5th Energy Update, I said it was very probable Natural Gas completed a major long-term bottom during this year’s Spring Shoulder period and prices will likely be significantly higher on average for at least three years.
I explained Shoulder Periods occur in the Spring and Fall when demand for Natural Gas and Electricity are low between the winter heating season and summer cooling seasons. It is common for important cyclical lows to occur during Shoulder Periods and as I have written in previous reports, I believe this year’s Spring low is no exception and is offering us one of the best buying opportunities I have seen in over 40-years of trading commodities based on the following:
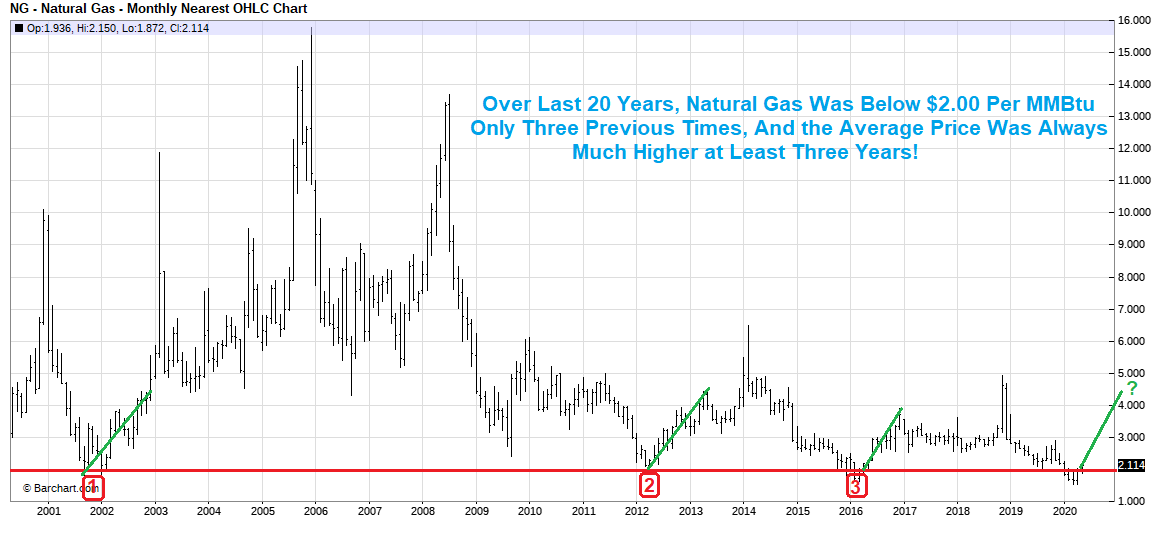
1) During this year’s Spring Shoulder period, Natural Gas declined to its lowest inflation adjusted price since it began trading in Natural Gas prices are unsustainably low.
2) They are below the cost of production, and companies are no longer profitable. Weaker companies will not survive, and companies who survive will be highly motivated to decrease production leading to higher prices.
3) The evidence Oil and Gas companies are decreasing production is reflected by recent Baker Hughes active rig counts. Over the last 6-weeks, active Oil rigs declined from 624 to 292, a decline of 2%, and 63.7% year-over-year. And year-over-year, Natural Gas has declined from 183 to 80 active rigs down 56.3%.
Over the last 20-years, Natural Gas was only near present levels 3 times, and as you can see below the average price was always much higher for at least three years:
Today’s report will focus on additional evidence supporting why I believe Natural Gas will increase significantly from present levels.
As mentioned in my introduction, Natural Gas prices are unsustainably low and stronger Oil & Gas companies will cut production leading to higher prices and profitability. Natural Gas exploration and production companies are not profitable with prices below $3.00 per MMBtu. Therefore, if the market believes Natural Gas is going to stay below $3.00 for an extended period, you expect Natural Gas stock prices too continue underperforming.
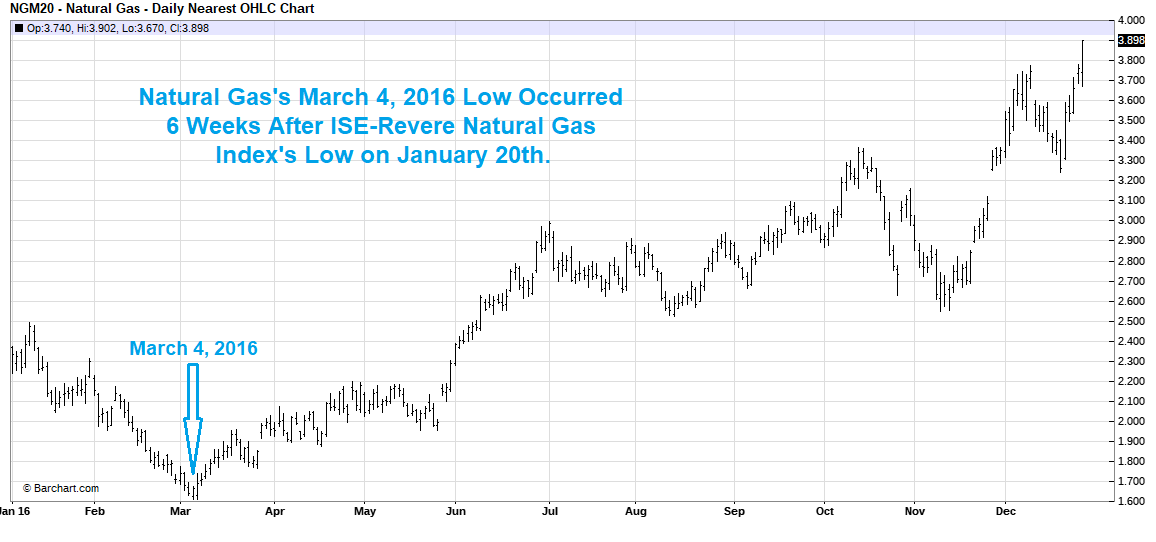
But since the stock market is forward looking and prices are based on future expected earnings, if the market believes Natural Gas prices will not remain low, then Natural Gas stock prices may start increasing before the commodity they produce. A clear example of this phenomenon took place in 2016, the last time Natural Gas prices were below $2.00 per MMBtu.
In 2016, Natural Gas reached its lowest price on March 4th at $1.61 per MMBtu, and still approached $4.00 per MMBtu by the end of the year:
The question is, did the stocks producing Natural Gas anticipate higher prices?
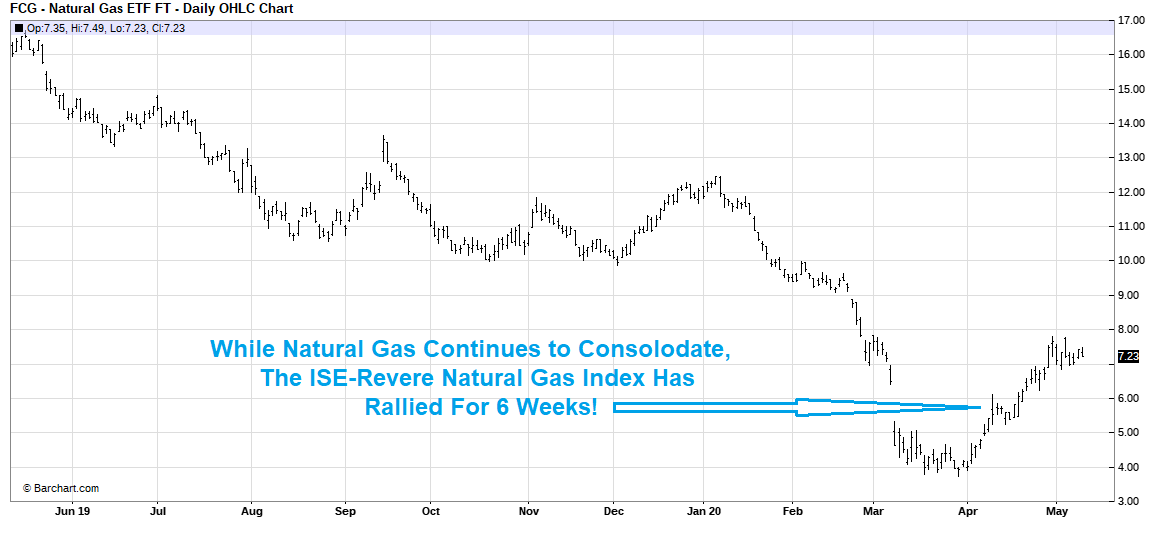
I chose the (ETF) FCG to measure the performance of Natural Gas stocks in 2016. FCG – seeks investments corresponding to the ISE-Revere Natural Gas Index. This Natural Gas Index is designed to track public companies that derive a substantial portion of their revenues from midstream activities and/or the exploration and production of Natural Gas:
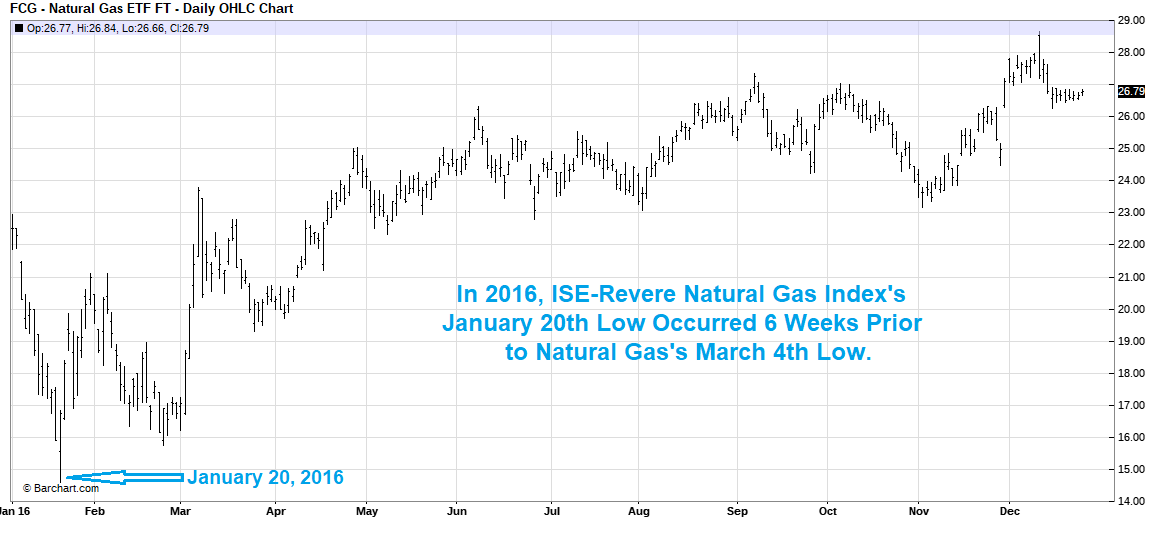
As you can see in the above chart the ISE-Revere Natural Gas Index started to rally January 20th, which was 6-weeks prior to Natural Gas’s March 4th low. As I said earlier, Natural Gas exploration and production companies are not profitable with prices below $3.00 per MMBtu. Therefore, those buying stocks in the ISE-Revere Natural Gas Index believed Natural Gas would not remain under $3.00 and in 2016 they right with Natural Gas approaching $4.00 by the end of the year!
The question is, are we seeing a similar setup in 2020?
First let us look how Natural Gas is presently trading:
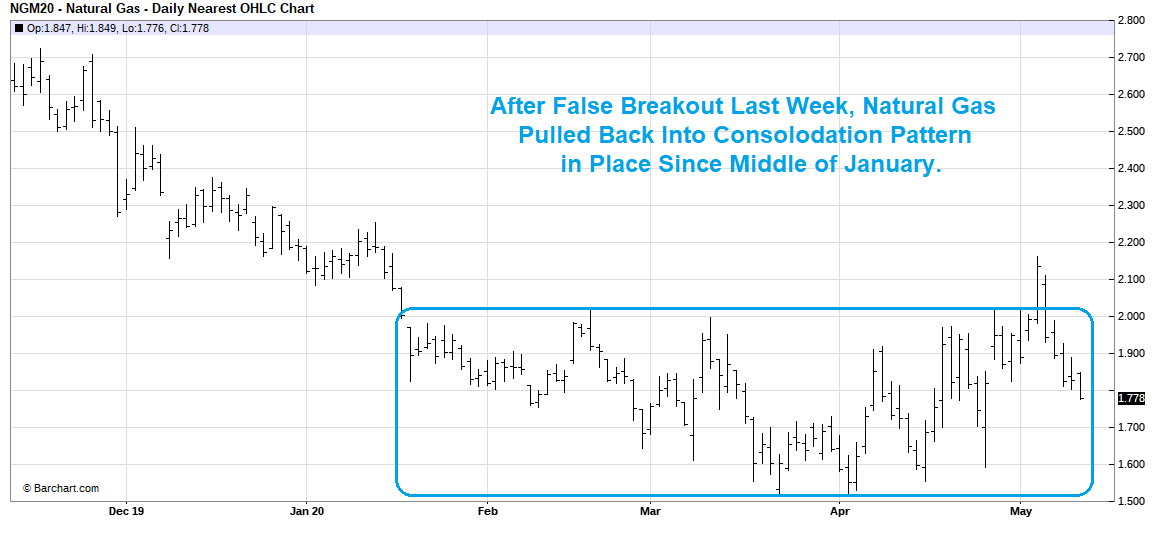
As I said in last week’s report, consolidation patterns form when traders are positioning themselves for long-term moves, and the longer it takes for the pattern to form the higher the subsequent move tends to be. This is especially true when the consolidation pattern is formed at a historically very low-price level.
The question is, is the ISE-Revere Natural Gas Index like 2016 telling us Natural Gas is preparing to move significantly above $3.00 per MMBtu?
Apparently, those buying stocks within the ISE-Revere Natural Gas Index believe like 2016 Natural Gas will not remain under $2.00 per MMBtu but are destined to rally significantly above $3.00 per MMBtu and become profitable again.
Over many years of trading, I learned past performance does not guarantee future results, but based on all of the evidence contained in today’s report, I believe the average price of Natural Gas will be much higher for at least three years. Therefore, if you have not already locked in today’s low rates, I recommend you do so as soon as possible. My concern is the longer you delay now, the more you may pay later.
Not every client’s risk tolerance and hedging strategy is the same, but the above report will help you put into perspective the risk/reward opportunities. I invite you to call one of our energy analysts to help you plan a hedging strategy appropriate for your situation.
Ray Franklin
Energy Professionals
Senior Commodity Analyst

Don't have one? You can get one by calling us at 855-4-PKIOSK.
Energy Professionals is committed to finding its customers the best possible rates on electricity and natural gas. Tell us your location and service type and our energy manager will connect you to the most competitive offers.
Switching to an alternate supplier is easy. There is no chance of service disruption, and you'll continue with your current utility for energy delivery and emergency service. Take a few minutes to discover your best offers, and enjoy the benefits of retail energy in your home or business.
1. Energy Type
2. Service Type
3. Zip Code
4.Local Company
5.Zone

We believe that knowledge is power. Here’s a free e-book that provides business solutions to reducing energy costs.
Download E-Book Free Energy Audit