


Energy Update |Oct 27, 2020
Are Natural Gas Structural Supply/Demand Imbalances Increasing the Risk of Higher Prices? In my Aug 31st Energy Update, I

Are Natural Gas Structural Supply/Demand Imbalances Increasing the Risk of Higher Prices? In my Aug 31st Energy Update, I
In my Aug 31st Energy Update, I said the Energy Information Administration’s (EIA’s) forecast of decreased Natural Gas production from declining active Oil and Gas rigs and increased demand from recently completed Mexican pipelines and Liquified Natural Gas exports would result in structural imbalances and increase the risk of higher Natural Gas prices long-term.
In my Sept 29th Energy Update, I said If the EIA’s forecast was correct, then seasonal pullbacks during “Shoulder Periods” were buying opportunities. The chart below reflects how Natural Gas traded after reaching its Fall low on Sept 21st:
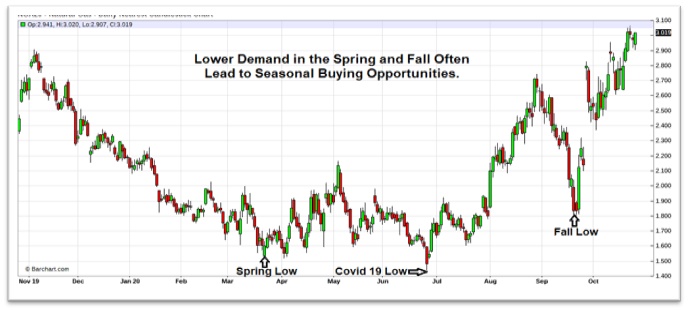
In my Sept 29th Energy Update, I also said we were likely in the early stages of a cyclical bull market; therefore, it would be wise to take advantage of seasonal declines to secure fixed rates. Shoulder periods occur in the Spring and Fall when demand for Natural Gas and Electricity are low between the Summer cooling and Winter heating seasons.
It is common for cyclical lows to occur during Shoulder periods and as expected Natural Gas rallied off its Spring low, but the rally was cut short by the Covid-19 shutdowns resulting in decreased demand and a retest of its Spring low on June 26th. But as you saw in the above chart, Natural Gas has sharply rallied off its Fall low.
Each week, the EIA releases a storage report reflecting the amount of Natural Gas in storage. As we approached the Winter heating season, it appeared we enjoyed a surplus of Natural Gas and enough to meet our winter heating demand. But as you can see in the tables below, Natural Gas’s surplus measured in Bcf, is beginning to decline versus the 5-Year Avg:
| Date | 2020 | Net Change | 5-Year Avg | Net Change | % Change |
| 10/02 | 3831 | +75 | 3421 | +83 | 12.0% |
| 10/09 | 3877 | +46 | 3512 | +91 | 10.4% |
| 10/16 | 3926 | +49 | 3588 | +76 | 9.1% |
On Oct 2nd, Natural Gas supplies were 12.0% above the 5-Year average, but two weeks later the surplus was 9.1%. And the surplus is expected to decline further the next three weeks:
| Date | 2020 | Net Change | 5-Year Avg | Net Change | % Change |
| 10/23 | 3960 | +34 | 3657 | +69 | 8.3% |
| 10/30 | 3952 | -8 | 3708 | +51 | 6.6% |
| 11/06 | 3953 | +1 | 3746 | +38 | 5.5% |
Natural Gas’s surplus appears to be evaporating declining from 12.0% to 5.5%. over five weeks from 10/02 thru 11/06.
You may hesitate locking in rates now because they are higher than where they were a few weeks ago. But hopefully after looking at the 5-Year Natural Gas chart below you will appreciate the wisdom of securing rates now and not delay hoping for lower rates later on:
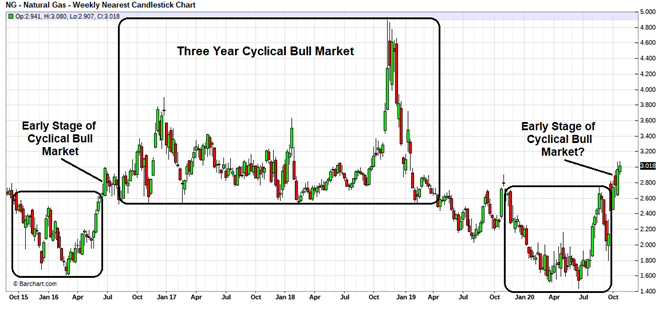
As I pointed out in the list of five risk factors, in 2016 when active Oil & Gas rigs were as low as today, the average price of Natural Gas was higher the next 3 years. In 2016, those who secured long-term fixed rates in the early stages of the cyclical bull market paid less than those who delayed hoping for lower prices that never arrived!
Over many years of trading, I learned past performance does not guarantee future results, but based on the EIA’s long-term production and demand estimates we will likely experience Natural Gas supply deficits in 2021, increasing the risk of higher prices long-term. Therefore, I recommend securing fixed rates prior to the winter heating season. My concern is the longer you delay, the more you may pay later.
Not every client’s risk tolerance and hedging strategy is the same, but the above report will help you put into perspective the risk/reward opportunities. I invite you to call one of our energy analysts to help you plan a hedging strategy appropriate for your situation.
Ray Franklin
Energy Professionals
Senior Commodity Analyst
Energy Professionals is committed to finding its customers the best possible rates on electricity and natural gas. Tell us your location and service type and our energy manager will connect you to the most competitive offers.
Switching to an alternate supplier is easy. There is no chance of service disruption, and you'll continue with your current utility for energy delivery and emergency service. Take a few minutes to discover your best offers, and enjoy the benefits of retail energy in your home or business.
1. Energy Type
2. Service Type
3. Zip Code

We believe that knowledge is power. Here’s a free e-book that provides business solutions to reducing energy costs.
Download E-Book Free Energy Audit
