


Risk Factors for Higher Natural Gas Prices This Summer
In my May 16th Energy Update, I said Natural Gas continued to move higher after the EIA released their Short


In my May 16th Energy Update, I said Natural Gas continued to move higher after the EIA released their Short
In my May 16th Energy Update, I said Natural Gas continued to move higher after the EIA released their Short Term Energy Outlook (STEO) on May 10th. In their report, the EIA said they expect the Henry Hub price would average $8.59/MMBtu in the second half of 2022. After their report, Natural Gas rallied from a low of $6.43/MMBtu on May 10th and last week rallied to $9.40/MMBtu before pulling back and starting this week near the EIA’s forecasted average price $8.59/MMBtu.
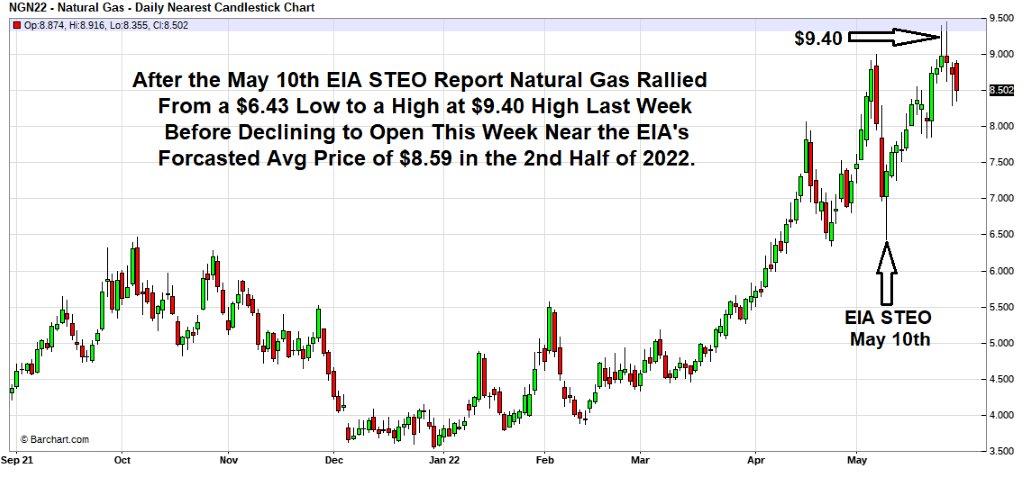
But the EIA report also warned Natural Gas prices could rise significantly above the forecasted average price of $8.59/MMBtu if summer temperatures were warmer than assumed in their report, which would result in electricity demand being higher than normal.
The first risk factor was summarized in the EIA’s May 10th STEO in which they said Natural Gas supplies will remain less than the five-year average this summer.
As of today’s report, Natural Gas supplies are approximately 15% below the five-year average three weeks before the start of the summer cooling season, which means a disruption in supplies or increase in demand this summer would likely result in an explosive rise in Natural Gas prices.
The second risk factor is the fore-mentioned risk of a warmer than normal summer discussed in the EIA’s May 10th STEO. Recently there has been a growing consensus temperature in the lower 48 states will be significantly warmer than normal. On May 19th NOAA released the following forecast for temperatures for the lower 48 states:
NOAA’s forecast of a warmer than normal summer is reinforced by most long-range weather forecasters including the Old Farmer’s Almanac’s most recent report stating the United States is in for another season of high heat. On average, they are predicting summer temperatures to be hotter than normal across most of the country, ranging from the Atlantic Corridor south to Florida, across to the West Coast, and almost everywhere in between.
The third risk factor is NOAA is forecasting an above-normal hurricane season in the Atlantic, with up to 21 named storms this year. The Atlantic hurricane season starts on June 1, and the Gulf of Mexico is already warmer than normal. Even more worrying is a warm tropical water current is looping unusually far into the Gulf for this time of year, with the power to turn tropical storms into monster hurricanes.
Dr. Nick Shay a preeminent professor of Meteorology and Physical Oceanography at Miami University warns the Loop Current this year looks remarkably similar to the way it did in 2005, the year Hurricane Katrina crossed the Loop Current before devastating New Orleans. Of the 27 named storms that year, seven became major hurricanes. Hurricanes Wilma and Rita also crossed the Loop Current that year and became two of the most intense Atlantic hurricanes on record.
If we experienced storms this year similar to 2005 with Natural Gas supplies already at very low levels the impact on energy prices could be catastrophic. It is not comforting to remember that Natural Gas prices reached their highest prices in recorded history near $16/MMBtu in 2005.
Although no one knows for sure where prices will be this summer, the three risk factors discussed in today’s report increase the risk prices could be significantly higher than where they are today.
Therefore, as I have said in recent reports If you have agreements expiring within the next few months, you should consider securing longer-term agreements since prices in the forward markets are still lower from 2023 thru 2026 than where they are today:
Month | 2022 | 2023 | 2024 | 2025 | 2026 |
Jan | 8.61 | 5.61 | 4.29 | 4.85 | |
Feb | 8.26 | 5.41 | 4.91 | 4.73 | |
Mar | 6.97 | 4.99 | 4.57 | 4.46 | |
Apr | 5.12 | 4.22 | 3.96 | 3.99 | |
May | 4.94 | 4.14 | 3.95 | 3.98 | |
Jun | 4.99 | 4.21 | 3.98 | 4.05 | |
Jul | 8.51 | 5.04 | 4.26 | 4.03 | 4.11 |
Aug | 8.51 | 5.02 | 4.27 | 4.05 | 4.13 |
Sep | 8.47 | 4.97 | 4.26 | 4.04 | 4.13 |
Oct | 8.44 | 5.04 | 4.32 | 4.11 | 4.19 |
Nov | 8.48 | 5.19 | 4.49 | 4.29 | 4.38 |
Dec | 8.52 | 5.47 | 4.85 | 4.66 | 4.73 |
AVG | 8.49 | 5.79 | 4.59 | 4.29 | 4.31 |
Also, as I said in recent reports, when appropriate our consultants can help you secure blend and extend agreements to take advantage of the expected sharp pullback when it finally comes. The bottom line is we are living in a period of great uncertainty, and we are here to help you navigate these perilous times
Not every client’s risk tolerance and hedging strategy are the same, but the above report will help you put into perspective the risk/reward opportunities. I invite you to call one of our energy analysts to help you plan a hedging strategy appropriate for your situation.
Ray Franklin
Energy Professionals
Senior Commodity Analyst

Don't have one? You can get one by calling us at 855-4-PKIOSK.
Energy Professionals is committed to finding its customers the best possible rates on electricity and natural gas. Tell us your location and service type and our energy manager will connect you to the most competitive offers.
Switching to an alternate supplier is easy. There is no chance of service disruption, and you'll continue with your current utility for energy delivery and emergency service. Take a few minutes to discover your best offers, and enjoy the benefits of retail energy in your home or business.
1. Energy Type
2. Service Type
3. Zip Code
4.Local Company
5.Zone

We believe that knowledge is power. Here’s a free e-book that provides business solutions to reducing energy costs.
Download E-Book Free Energy Audit